NanoMethViz is a Bioconductor package designed to visualise methylation data from long-read sequencing. It provides a simple interface to plot methylation data and perform dimensionality reduction on a per-read basis.
The package is designed to work with methylation data from the Oxford Nanopore Technologies (ONT) platform. It supports:
- modBAM files from dorado and other ONT software
-
Tabular methylation calls from:
- modkit (tsv generated by
modkit extract full) - Megalodon (tsv)
- Nanopolish (tsv)
- f5c (tsv)
- modkit (tsv generated by
Features are developed for 5mC CpG methylation but will work with other modifications if data is in the correct format. If you would like additional formats supported, please create an issue at https://github.com/Shians/NanoMethViz/issues.
Installation
Install from Bioconductor:
if (!requireNamespace("BiocManager", quietly = TRUE)) {
    install.packages("BiocManager")
}
BiocManager::install("NanoMethViz")
Install the Bioconductor devel version:
if (!requireNamespace("BiocManager", quietly = TRUE)) {
    install.packages("BiocManager")
}
BiocManager::install(version = "devel")
BiocManager::install("NanoMethViz")
Quick Start
To generate a methylation plot, you need three components:
- Methylation data: bgzip-compressed and tabix-indexed file or modBAM file containing methylation calls
-
Sample annotation:
data.framewith at least asamplecolumn -
Gene/exon annotation:
data.framewith columnsgene_id,chr,strand,start,end,transcript_id,symbol
library(NanoMethViz)
# Load bundled example data
nmr <- load_example_nanomethresult()
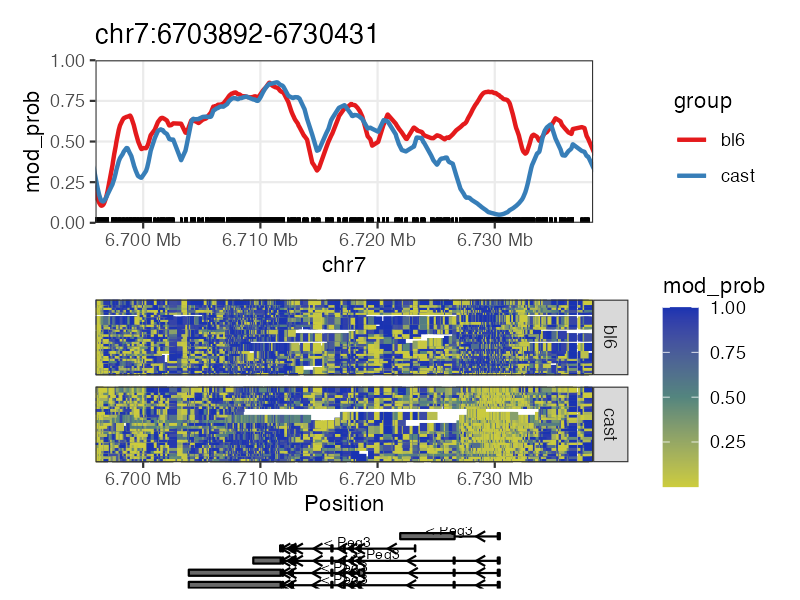
# Plot methylation for a single gene
plot_gene(nmr, "Peg3")
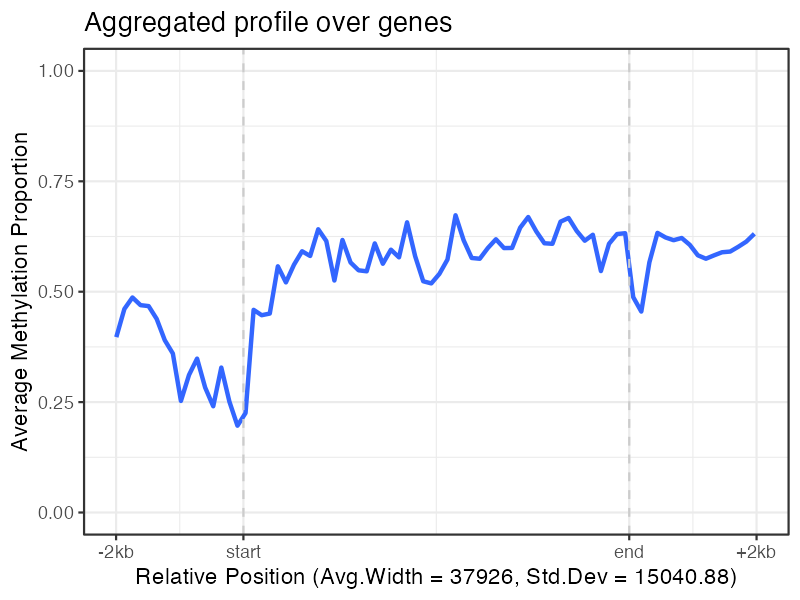
# Aggregate methylation across multiple genes
plot_agg_genes(nmr)
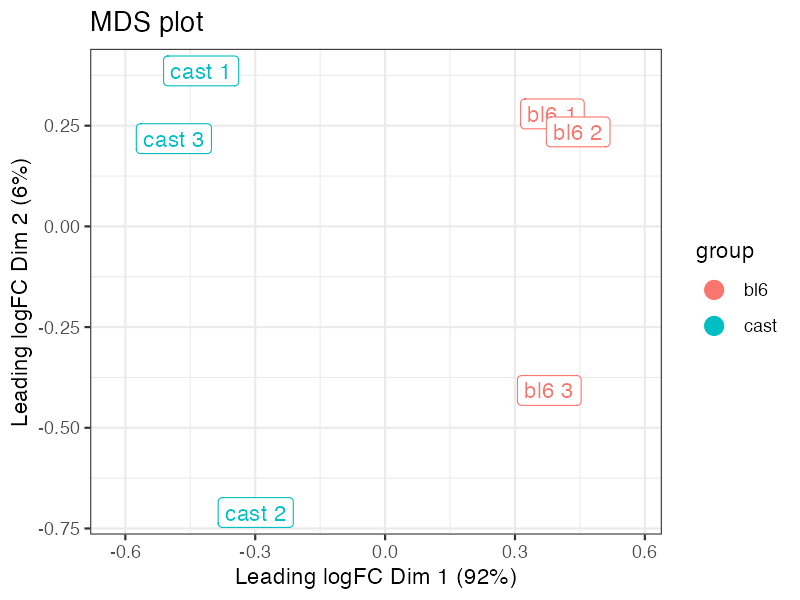
# Dimensionality reduction on methylation profiles
bss <- methy_to_bsseq(nmr)
gene_regions <- exons_to_genes(exons(nmr))
lmr <- bsseq_to_log_methy_ratio(bss, gene_regions)
plot_mds(lmr)
plot_pca(lmr)Typical Workflow
- Import methylation calls from your ONT sequencing software (dorado, modkit, Megalodon, Nanopolish, or f5c).
-
Convert to tabix format if needed using
create_tabix_file()ormodbam_to_tabix().- For modBAM files, use
ModBamResultdirectly without conversion. - Data must be sorted by genomic position to meet tabix requirements.
- For modBAM files, use
-
Prepare annotations: Sample metadata with a
samplecolumn and gene/exon annotation usingget_exons_hg38(),get_exons_mm10(), or custom annotation. -
Build a result object:
NanoMethResult()for tabix files orModBamResult()for modBAM files. - Visualise and analyse: Use plotting functions, query methylation data, perform dimensionality reduction, and export for downstream analysis.
- Export results: Convert to bsseq format for differential analysis tools.
Importing Data
For NanoMethResult, data must be in tabix format (bgzip-compressed and tabix-indexed) and sorted by genomic position. Use create_tabix_file() to convert tabular data from modkit, Megalodon, Nanopolish, or f5c.
modBAM Data
Recent versions of dorado and ONT software store modifications directly in BAM files. These can be used with ModBamResult without conversion:
mbr <- ModBamResult(
    methy = ModBamFiles(
        samples = c("sample1", "sample2"),
        c("path/to/sample1.bam", "path/to/sample2.bam")
    ),
    samples = data.frame(sample = c("sample1", "sample2"), group = c("A", "B")),
    exons = exon_tibble
)
For sharing, convert to tabix format using modbam_to_tabix().
Annotations
Use helper functions for common organisms: get_exons_hg38(), get_exons_mm10(), get_exons_grcm39(), or provide custom annotation. See the Importing Annotations section of the user’s guide for details.
Common Tasks
Plotting regions: plot_gene(), plot_region() for single genes or genomic intervals; plot_gene_heatmap(), plot_region_heatmap() for per-read heatmaps.
Aggregate analysis: plot_agg_genes(), plot_agg_regions() for group-level summaries.
Dimensionality reduction: Convert to bsseq format with methy_to_bsseq(), compute log-methylation ratios with bsseq_to_log_methy_ratio(), then visualize with plot_mds() or plot_pca().
Querying data: Extract methylation values for regions using query_methy() or filter with filter_methy().
Export for downstream analysis: Use methy_to_bsseq() for bsseq/DSS, or bsseq_to_edger() for edgeR differential methylation analysis.
See the function reference for complete function documentation and examples.
Data Requirements & Configuration
Data format requirements: - Chromosome naming must be consistent across methylation calls and annotation - Sample names must match exactly between methylation data and samples$sample - Exon annotation requires columns: gene_id, chr, strand, start, end, transcript_id, symbol
Package options: - NanoMethViz.site_filter (default: 3) - Remove sites with coverage below threshold - NanoMethViz.highlight_col (default: “grey50”) - Color for annotated regions in plots
Documentation
- User Guide (pkgdown site): https://shians.github.io/NanoMethViz/articles/UsersGuide.html
- Function reference index: https://shians.github.io/NanoMethViz/reference/index.html
- Issue tracker: https://github.com/Shians/NanoMethViz/issues