Plot aggregate regions
Usage
plot_agg_regions(
  x,
  regions,
  binary_threshold = 0.5,
  group_col = NULL,
  flank = 2000,
  stranded = TRUE,
  span = 0.05,
  palette = ggplot2::scale_colour_brewer(palette = "Set1")
)
Arguments
- x
the NanoMethResult or ModBamResult object.
- regions
a table of regions containing at least columns chr, strand, start and end. Any additional columns can be used for grouping.
- binary_threshold
the modification probability such that calls with modification probability above the threshold are considered methylated, and those with probability equal or below are considered unmethylated.
- group_col
the column name to group aggregated trends by. This column can be found in either the regions table or samples(x). When NULL (default), all data is aggregated together. Common values include "sample" to show individual samples or "group" to show sample groups.
- flank
the number of flanking bases to add to each side of each region.
- stranded
if TRUE, negative strand features will have their coordinates flipped to reflect biological features like transcription start sites (e.g., for genes, coordinates run from TSS to TES regardless of strand).
- span
the span parameter for loess smoothing of the trend lines.
- palette
the ggplot colour palette used for groups.
Examples
nmr <- load_example_nanomethresult()
#> Successfully matched 6 samples between data and annotation.
gene_anno <- exons_to_genes(NanoMethViz::exons(nmr))
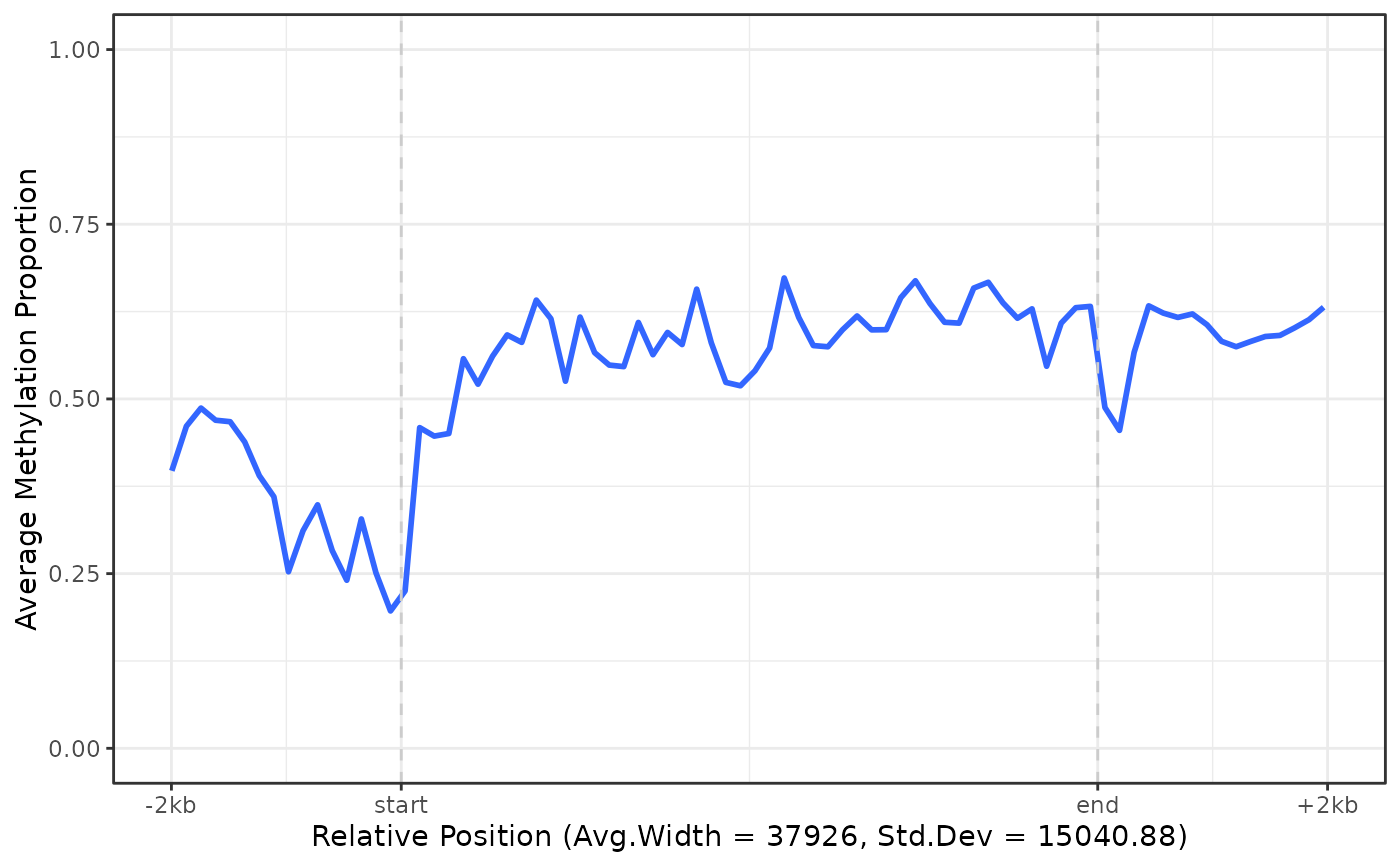
plot_agg_regions(nmr, gene_anno)
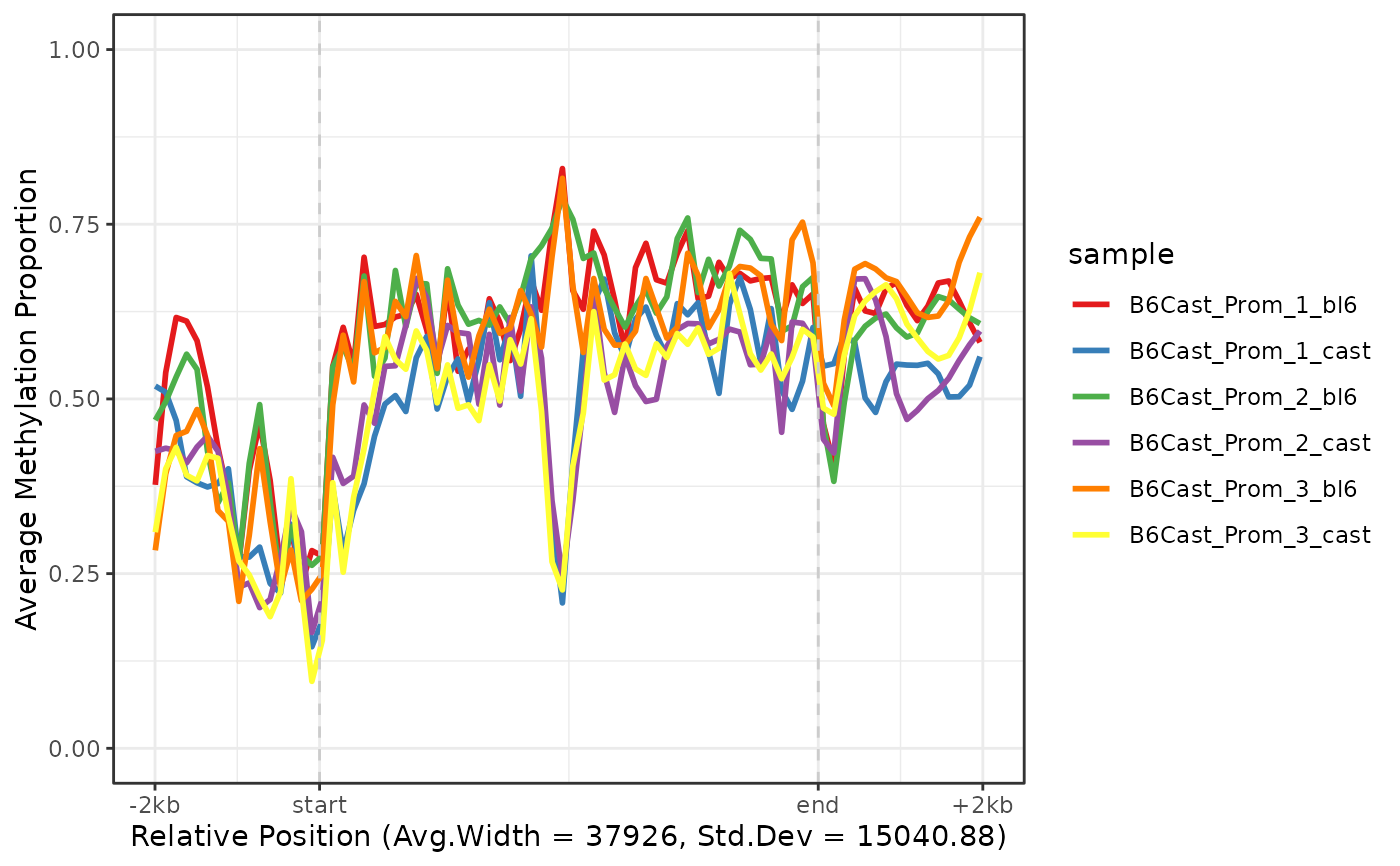
 plot_agg_regions(nmr, gene_anno, group_col = "sample")
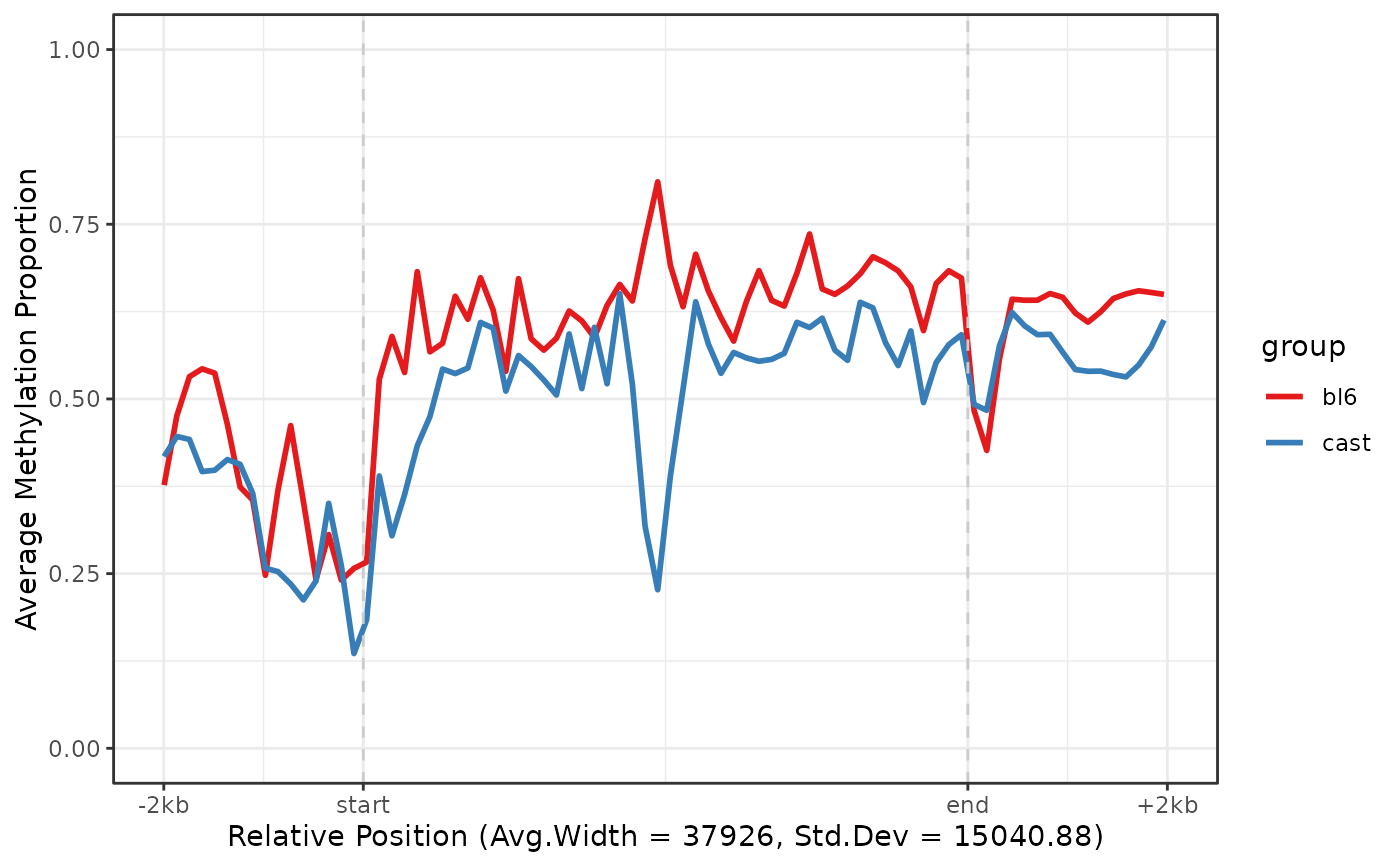
 plot_agg_regions(nmr, gene_anno, group_col = "group")