Plot region methylation heatmap
Source:R/AllGenerics.R, R/plot_region_heatmap.R
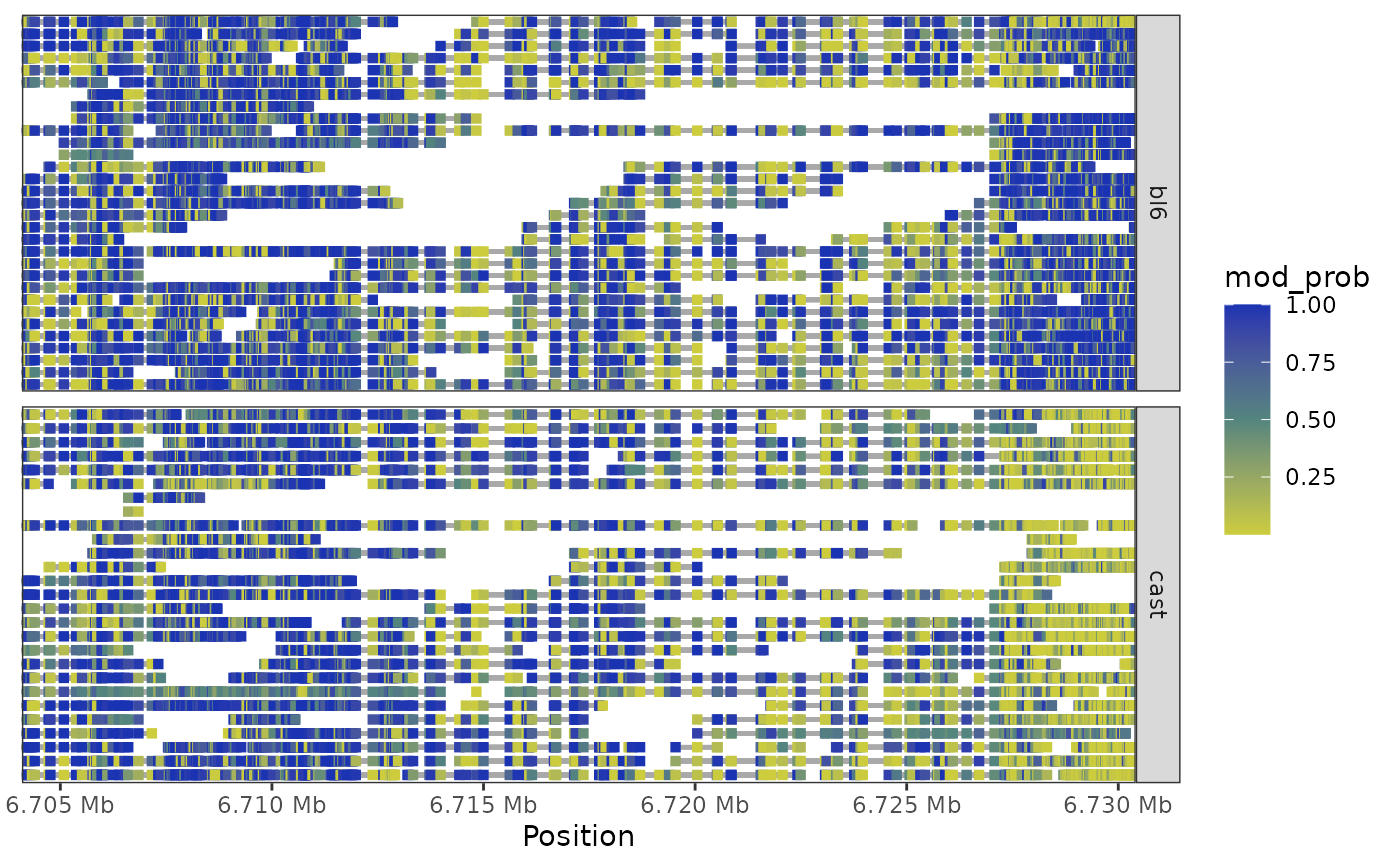
plot_region_heatmap.RdPlot the methylation heatmap of a genomic region.
Usage
plot_region_heatmap(x, chr, start, end, ...)

# S4 method for class 'NanoMethResult,character,numeric,numeric'
plot_region_heatmap(
  x,
  chr,
  start,
  end,
  pos_style = c("to_scale", "compact"),
  window_prop = 0,
  subsample = 50
)

# S4 method for class 'ModBamResult,character,numeric,numeric'
plot_region_heatmap(
  x,
  chr,
  start,
  end,
  pos_style = c("to_scale", "compact"),
  window_prop = 0,
  subsample = 50
)

# S4 method for class 'NanoMethResult,factor,numeric,numeric'
plot_region_heatmap(
  x,
  chr,
  start,
  end,
  pos_style = c("to_scale", "compact"),
  window_prop = 0,
  subsample = 50
)

# S4 method for class 'ModBamResult,factor,numeric,numeric'
plot_region_heatmap(
  x,
  chr,
  start,
  end,
  pos_style = c("to_scale", "compact"),
  window_prop = 0,
  subsample = 50
)
Arguments
- x
the NanoMethResult or ModBamResult object.
- chr
the chromosome to plot.
- start
the start of the plotting region.
- end
the end of the plotting region.
- ...
additional arguments.
- pos_style
the style for plotting the base positions along the x-axis. Defaults to "to_scale", plotting (potentially) overlapping squares along the genomic position to scale. The "compact" options plots only the positions with measured modification.
- window_prop
the size of flanking region to plot. Can be a vector of two values for left and right window size. Values indicate proportion of region length.
- subsample
the number of read of packed read rows to subsample to.
Details
This function creates a heatmap visualisation of methylation data for a specified genomic region. Each row represents one or more packed reads, with colored segments indicating methylation probability at each position. Reads are packed vertically to minimize plot height while avoiding overlaps.
Examples
nmr <- load_example_nanomethresult()
#> Successfully matched 6 samples between data and annotation.
plot_region_heatmap(nmr, "chr7", 6703892, 6730431)