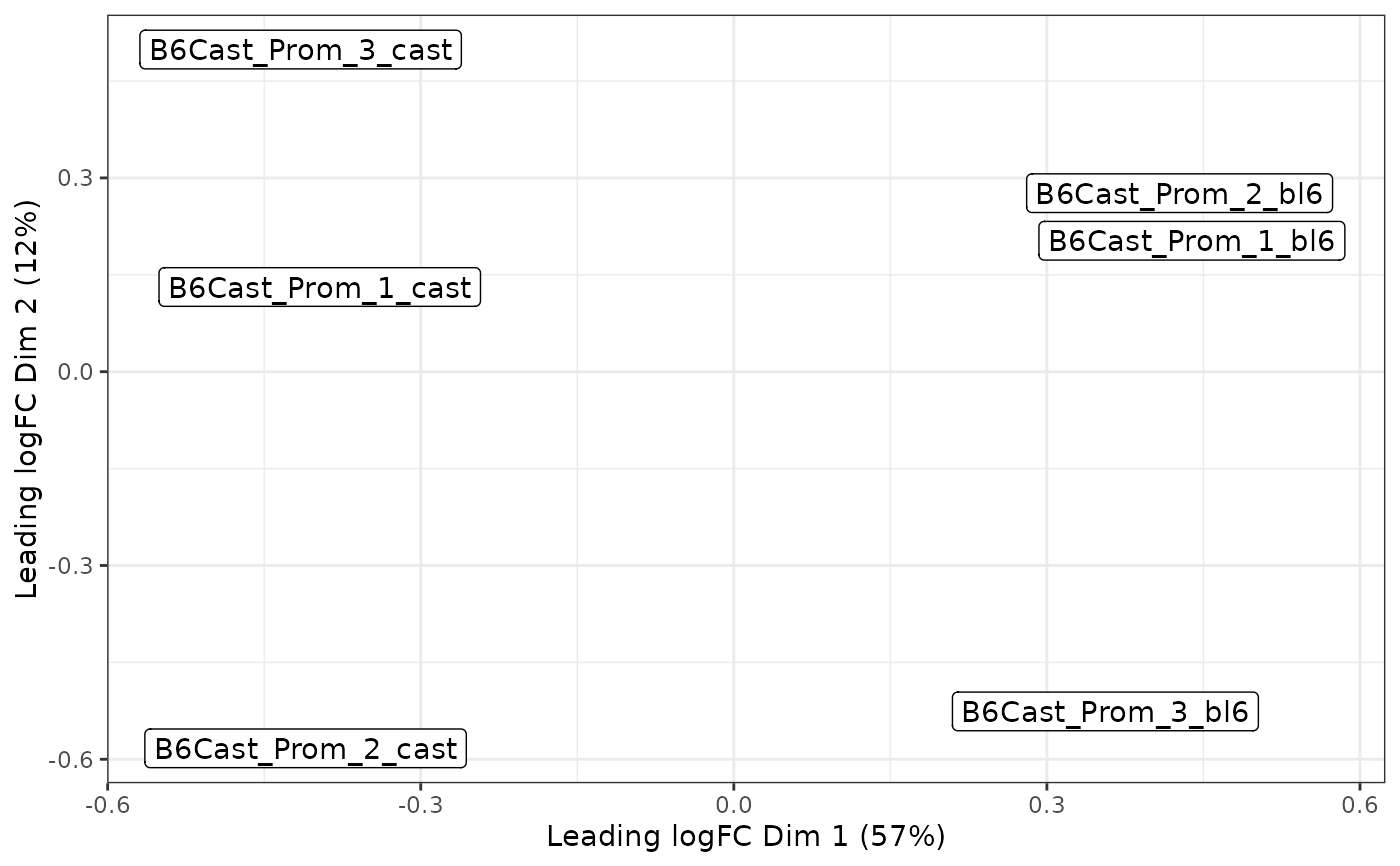
Plot multi-dimensional scaling plot using algorithm of limma::plotMDS(). It is recommended this be done with the log-methylation-ratio matrix generated by bsseq_to_log_methy_ratio().
Arguments
- x
a numeric matrix of log-methylation-ratio values where rows are genomic regions/features and columns are samples.
- top
the number of top variable features (genes/regions) used to calculate pairwise distances between samples.
- plot_dims
the numeric vector of the two dimensions to be plotted (default c(1, 2) for first two principal coordinates).
- labels
the character vector of labels for data points. By default uses column names of x, set to NULL to plot unlabeled points.
- groups
the character vector or numeric vector of groups that data points will be coloured by. For character vectors, discrete colours are used. For numeric vectors, continuous colour scale is used. By default, groups is NULL and points are not coloured.
- legend_name
the name for the colour legend.
Details
Multi-dimensional scaling (MDS) is a dimensionality reduction technique that represents high-dimensional distances between samples in a lower-dimensional space (typically 2D). This function uses limma's plotMDS algorithm, which selects the most variable features and calculates leading log-fold-change distances between samples. The resulting plot shows samples as points where proximity indicates similarity in methylation profiles. When variance explained is available, it is shown as percentages on the axis labels.
Examples
nmr <- load_example_nanomethresult()
#> Successfully matched 6 samples between data and annotation.
bss <- methy_to_bsseq(nmr)
#> [2026-07-03 10:25:01] creating intermediate files...
#> [2026-07-03 10:25:01] parsing chr11...
#> [2026-07-03 10:25:01] parsing chr12...
#> [2026-07-03 10:25:01] parsing chr18...
#> [2026-07-03 10:25:01] parsing chr5...
#> [2026-07-03 10:25:01] parsing chr7...
#> [2026-07-03 10:25:01] parsing chrX...
#> [2026-07-03 10:25:01] samples found: B6Cast_Prom_3_cast B6Cast_Prom_3_bl6 B6Cast_Prom_2_cast B6Cast_Prom_2_bl6 B6Cast_Prom_1_cast B6Cast_Prom_1_bl6
#> [2026-07-03 10:25:01] creating bsseq object...
#> [2026-07-03 10:25:01] reading in parsed data...
#> [2026-07-03 10:25:01] constructing matrices...
#> [2026-07-03 10:25:01] done
lmr <- bsseq_to_log_methy_ratio(bss)
plot_mds(lmr)