Plot principal component analysis plot using BiocSingular::runPCA(). It is recommended this be done with the log-methylation-ratio matrix generated by bsseq_to_log_methy_ratio().
Arguments
- x
a numeric matrix where rows are genomic regions/features and columns are samples. Should be a log-methylation-ratio matrix for best results.
- plot_dims
the numeric vector of the two dimensions to be plotted (default c(1, 2) for PC1 vs PC2).
- labels
the character vector of labels for data points. By default uses column names of x, set to NULL to plot unlabeled points.
- groups
the character vector or numeric vector of groups that data points will be coloured by. For character vectors, discrete colours are used. For numeric vectors, continuous colour scale is used. By default, groups is NULL and points are not coloured.
- legend_name
the name for the colour legend.
Details
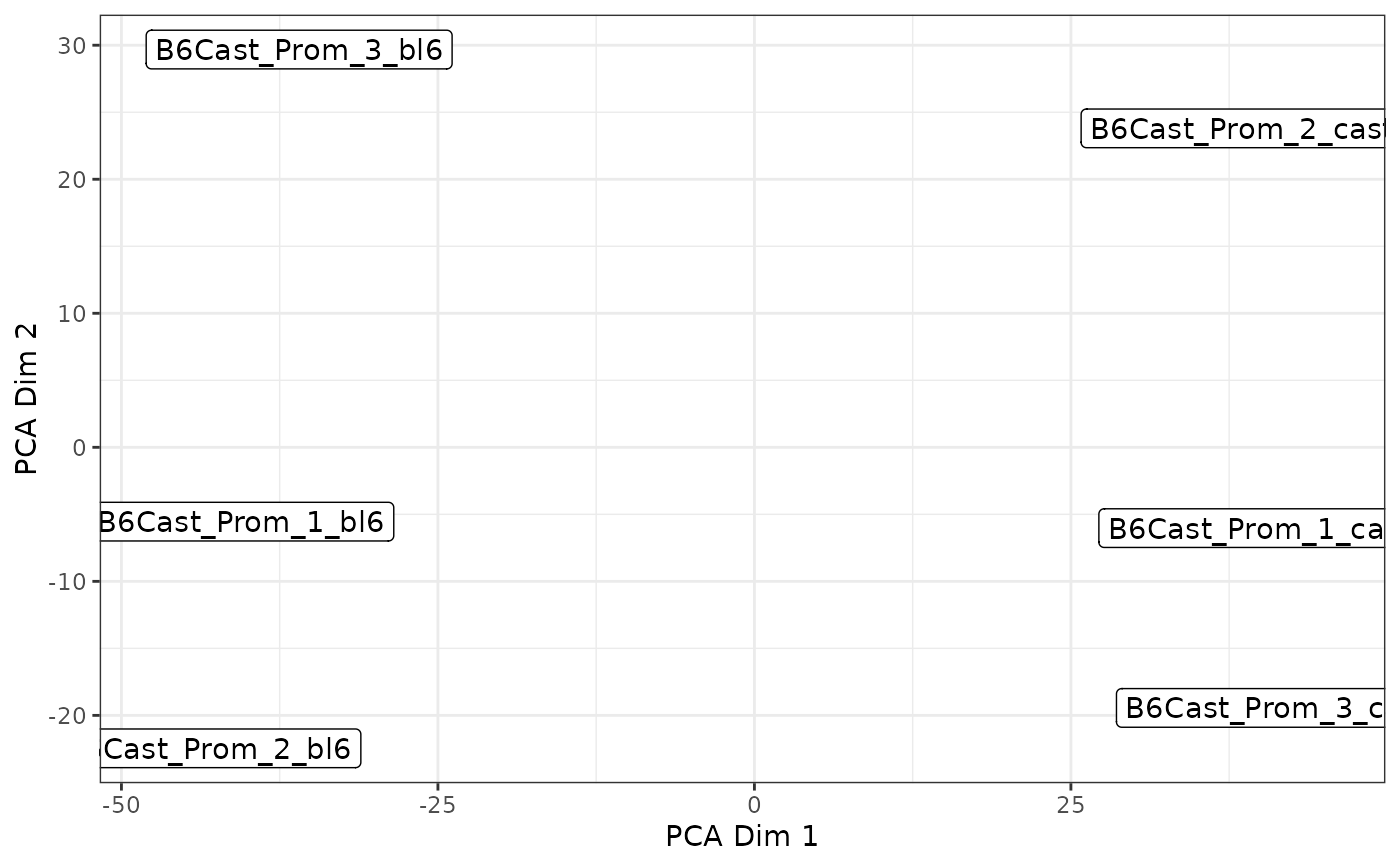
Principal Component Analysis (PCA) is a dimensionality reduction technique that identifies the directions of maximum variance in high-dimensional data. Unlike MDS, PCA axis labels show the principal component numbers rather than variance explained percentages. The first principal component (PC1) captures the most variance in the data, PC2 captures the second most, and so on. Samples that cluster together have similar methylation profiles across the genomic regions included in the analysis.
Examples
nmr <- load_example_nanomethresult()
#> Successfully matched 6 samples between data and annotation.
bss <- methy_to_bsseq(nmr)
#> [2026-07-03 10:25:02] creating intermediate files...
#> [2026-07-03 10:25:02] parsing chr11...
#> [2026-07-03 10:25:02] parsing chr12...
#> [2026-07-03 10:25:02] parsing chr18...
#> [2026-07-03 10:25:02] parsing chr5...
#> [2026-07-03 10:25:02] parsing chr7...
#> [2026-07-03 10:25:02] parsing chrX...
#> [2026-07-03 10:25:02] samples found: B6Cast_Prom_3_cast B6Cast_Prom_3_bl6 B6Cast_Prom_2_cast B6Cast_Prom_2_bl6 B6Cast_Prom_1_cast B6Cast_Prom_1_bl6
#> [2026-07-03 10:25:02] creating bsseq object...
#> [2026-07-03 10:25:02] reading in parsed data...
#> [2026-07-03 10:25:02] constructing matrices...
#> [2026-07-03 10:25:03] done
lmr <- bsseq_to_log_methy_ratio(bss)
plot_pca(lmr)