This function plots a violin plot of the methylation proportion for each
region in the regions table. The methylation proportion is calculated as the
mean of the modification probability within each region, and the violin shows
the distribution across groups. Regions are grouped and coloured by the
group_col column in the regions table or samples(x).
Usage
plot_violin(
  x,
  regions,
  binary_threshold = 0.5,
  group_col = "group",
  palette = ggplot2::scale_colour_brewer(palette = "Set1")
)
Arguments
- x
the NanoMethResult object.
- regions
a table of regions containing at least columns chr, strand, start and end. Any additional columns can be used for grouping.
- binary_threshold
the modification probability such that calls with modification probability above the threshold are considered methylated, and those with probability equal or below are considered unmethylated.
- group_col
the column to group aggregated trends by. This column can be in from the regions table or samples(x).
- palette
the ggplot colour palette used for groups.
Examples
nmr <- load_example_nanomethresult()
#> Successfully matched 6 samples between data and annotation.
gene_anno <- exons_to_genes(NanoMethViz::exons(nmr))
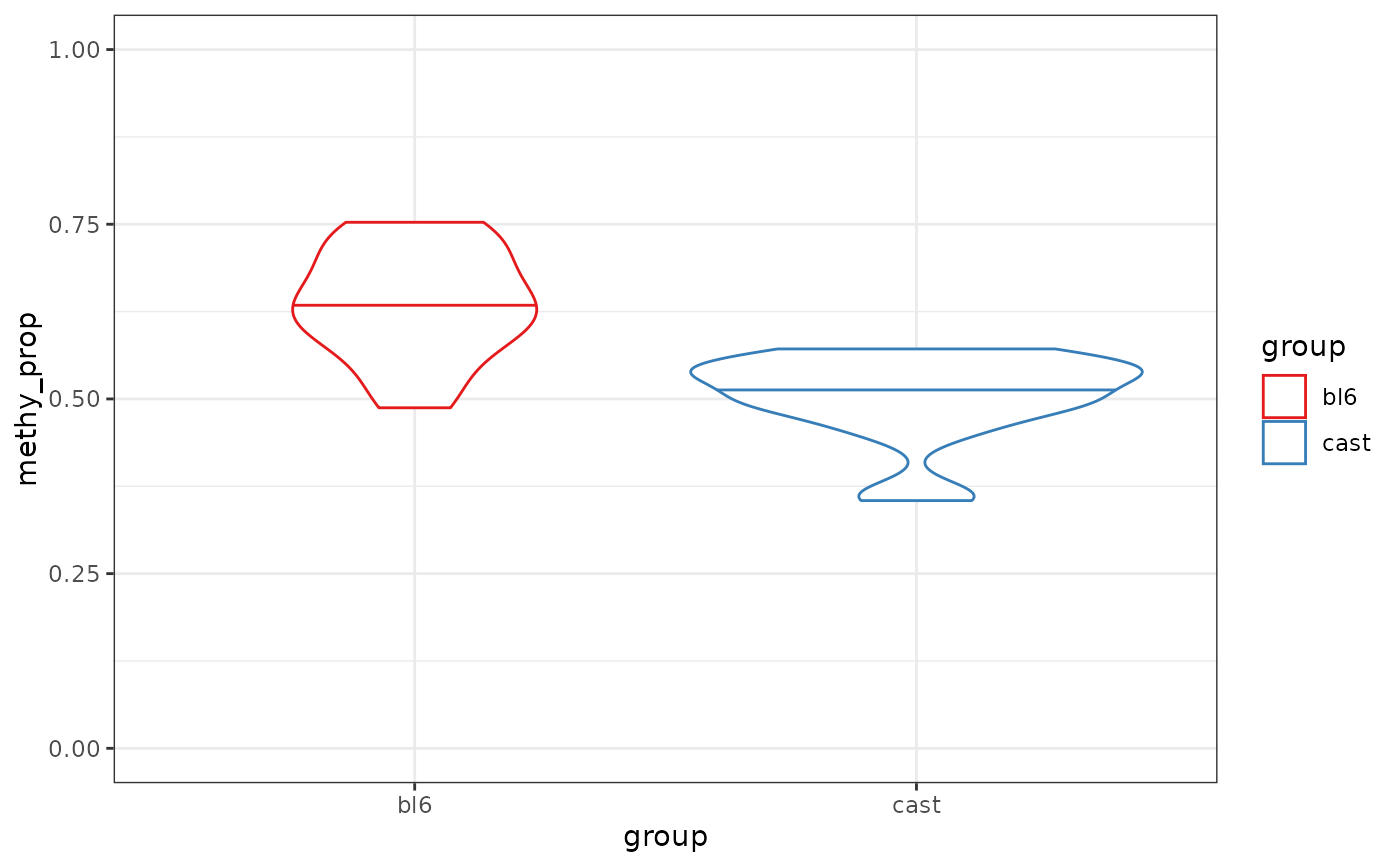
plot_violin(nmr, gene_anno)
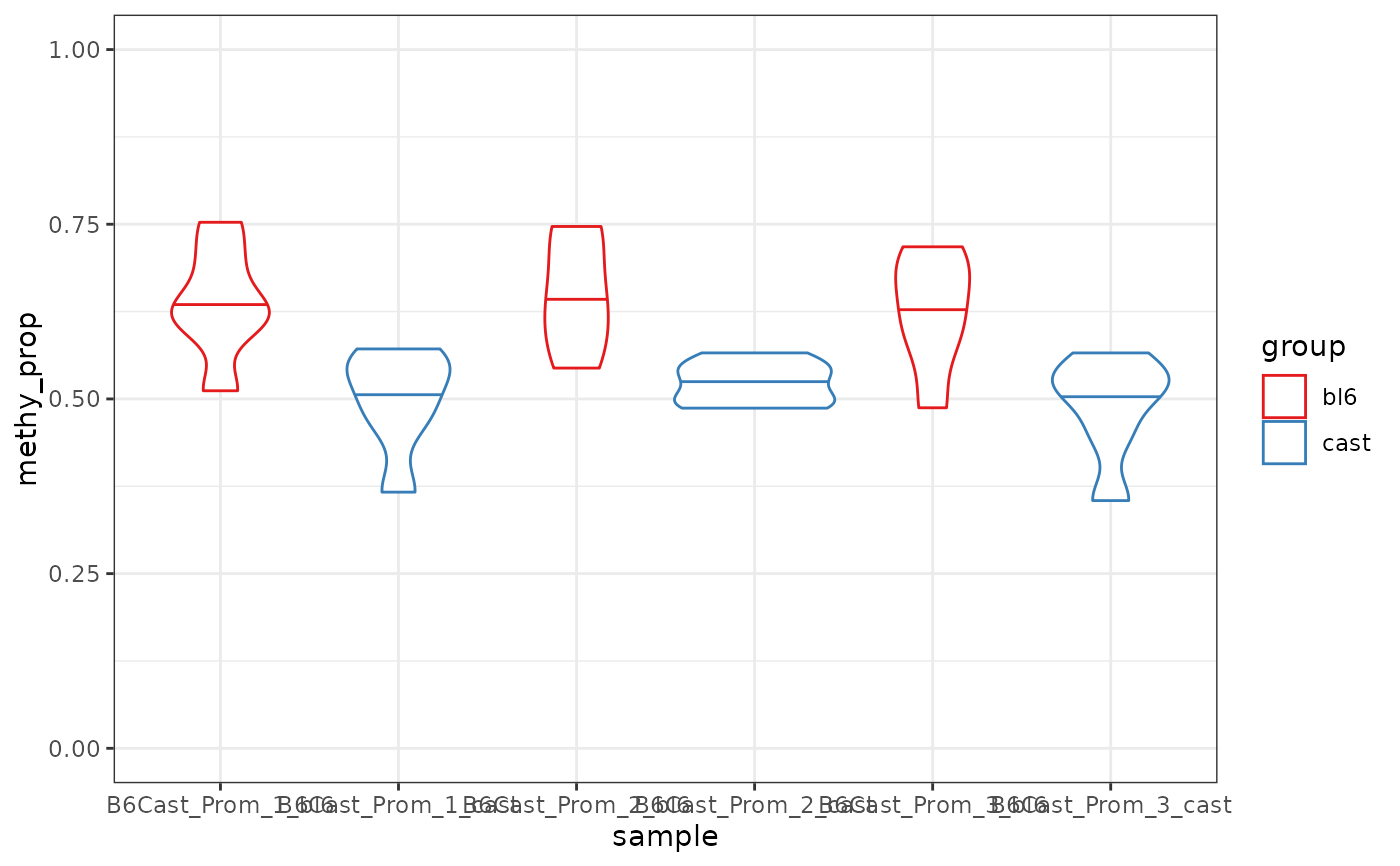
 plot_violin(nmr, gene_anno, group_col = "sample")